As described in the overview, Conditional Formatting ("CF") allows users to highlight important items in a visualization using mathematical or logical rules and graphical adjustments to the underlying chart or grid. The functionality can be set from multiple "entry points" in Discover including the context menu, drop zones, or via the KPI wizards. However, the Conditional Formatting Dialog represents the most detailed and most advanced interface for setting up and configuring the logic to conditionally adjust colors and indicators. And although the KPI wizards can build sophisticated formula logic to drive the formatting, the dialog remains the interface with the most granular control over how such logic is displayed in relevant visuals.
In older versions of the platform, a basic version of this dialog was represented through the "advanced color" option.
Using the Conditional Formatting Dialog
Accessing the Dialog
The CF dialog can be opened by clicking the Conditional Formatting button in the Design ribbon of Discover. The dialog will slide up from the bottom of the screen.

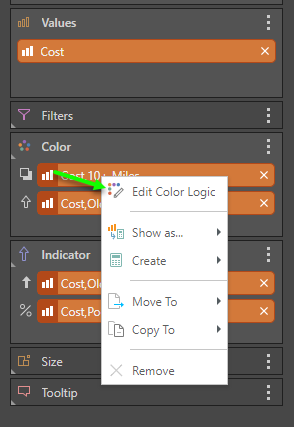
Alternatively, users can right click on any orange measure chips in either the color or indicator drop zones and choose Edit Color Logic or Edit Indicator Logic. (Note that when using Gauges, the indicator functionality resides in the Status Drop Zone.)
Dialog Anatomy
The CF dialog has three main zones:
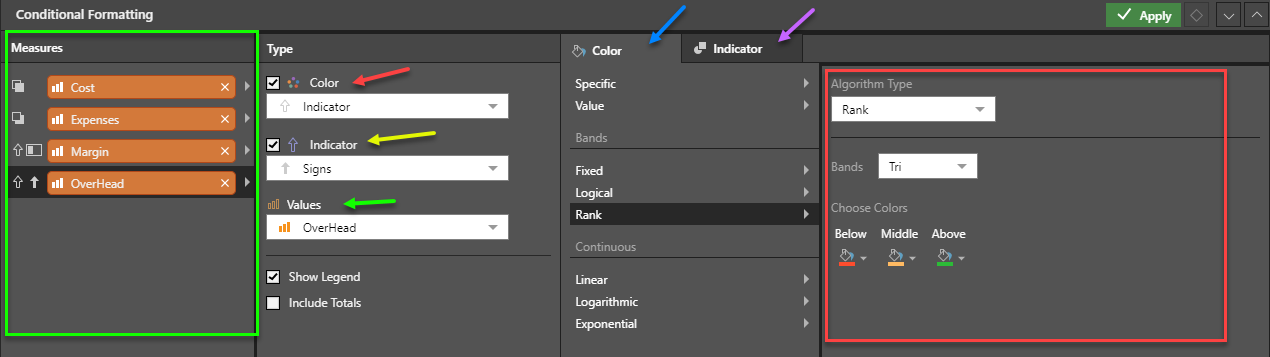
- Measure panel: The listing of different conditional formatting rules is demarcated by the measure that drives its logic. As such, the measure panel (green box below) is both used as a way to see which CF rules are active as well as a technique for selecting a given rule to see its settings.
- Click on a measure to select the rule.
- Click the "x" to delete the rule.
- Type Settings panel: the next panel shows which CF effects are active for the selected measure / rule. The effects are split into color (red arrow) and indicator (yellow arrow). In this way, any rules set in the color or indicator drop zones are reflected here. Importantly, many CF items contain both items, hence the ability to set both color and indicator for each CF measure / rule.
- The Values dropdown list (green arrow) indicates against which visible measure the CF measure / rule will be applied to. Choosing "All" will apply the logic to all visible measures in the query.
- While most CF rules should be accompanied with a legend to show users the inherent banding of the values, there are situations where users may elect to hide the legend. This is most prevalent with Gauges and KPI's built with the KPI wizard - where a legend is generally counterproductive.
- Typically totals should be excluded from CF logic and calculations (the standard default). As such there is an option to include or exclude totals from the CF logic for a given measure / rule.
- The "lighten" choice appears when the background color option is used. Lightening the colors makes it easier to read the foreground fonts.
- Effects and Settings panel: Tabs will be shown for color (blue arrow), indicator (purple arrow) or both depending on which types have been enabled.
- Within each tab, there are numerous ways to set the formatting logic (red box), including specific (discrete) color; value driven colors; banded colors or indicators; and, continuous colors or indicators.
- Click here to read more on conditional formatting settings and logic
Conditional Formatting Rules and Measures
As described above, each measure added to the color or indicator drop zone ultimately drives a conditional formatting "rule" which describes how to format the visual. As such, the orange measure "chips" added to each drop zone, as per below, will appear in the left panel of the dialog (as shown in the green box above).
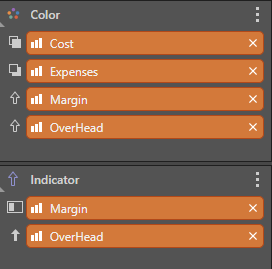
Importantly, when the same measure drives both color and indicator, it appears as 2 chips in each respective drop zone, but is combined as a single rule in the dialog box. For example, Overhead and Margin (below) drive both color and indicator formatting rules, and appear twice each. Yet above, they are combined into single chips.
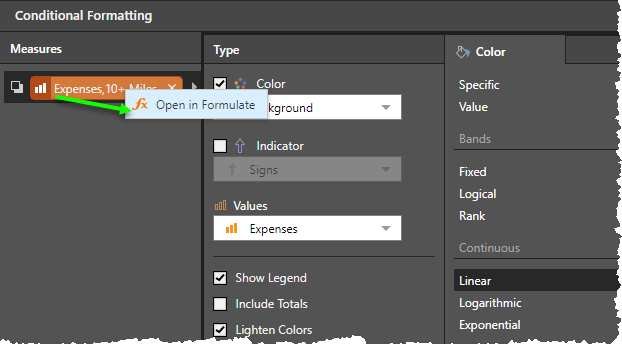
Editing Measures used in Conditional Formatting
Users can edit the orange measure chips used in CF logic by right-clicking on the chip and opening it in the Formulate tools. Here, users can set the measure structure up to drive which cells in the query the logic will run against.
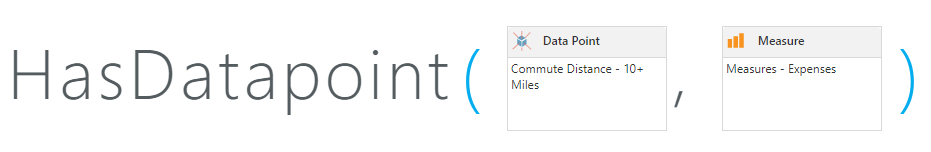
HasDataPoint
A key function here is the "HasDataPoint" method, which returns true if any data points or cells in the calling query contain the member elements defined in this function. It effectively provides a very tight mechanism of "painting" the right cells that are included in the function definition with CF logic and ignoring those that don't.